L1 cache size vs performance
How much does L1 cache size matter for Ventium’s performance, and where does
it stop mattering? This page measures it directly in the cycle-accurate
model — the same cycle_mode the M4/M5 gates use, where the dual-issue U/V
pipeline and the L1 miss-timing state machine are live — and shows that the
answer has a sharp, well-understood structure: a knee governed by the ratio
of the working set to the cache capacity, whose shape is the direct fingerprint
of the cache’s two-way associativity.
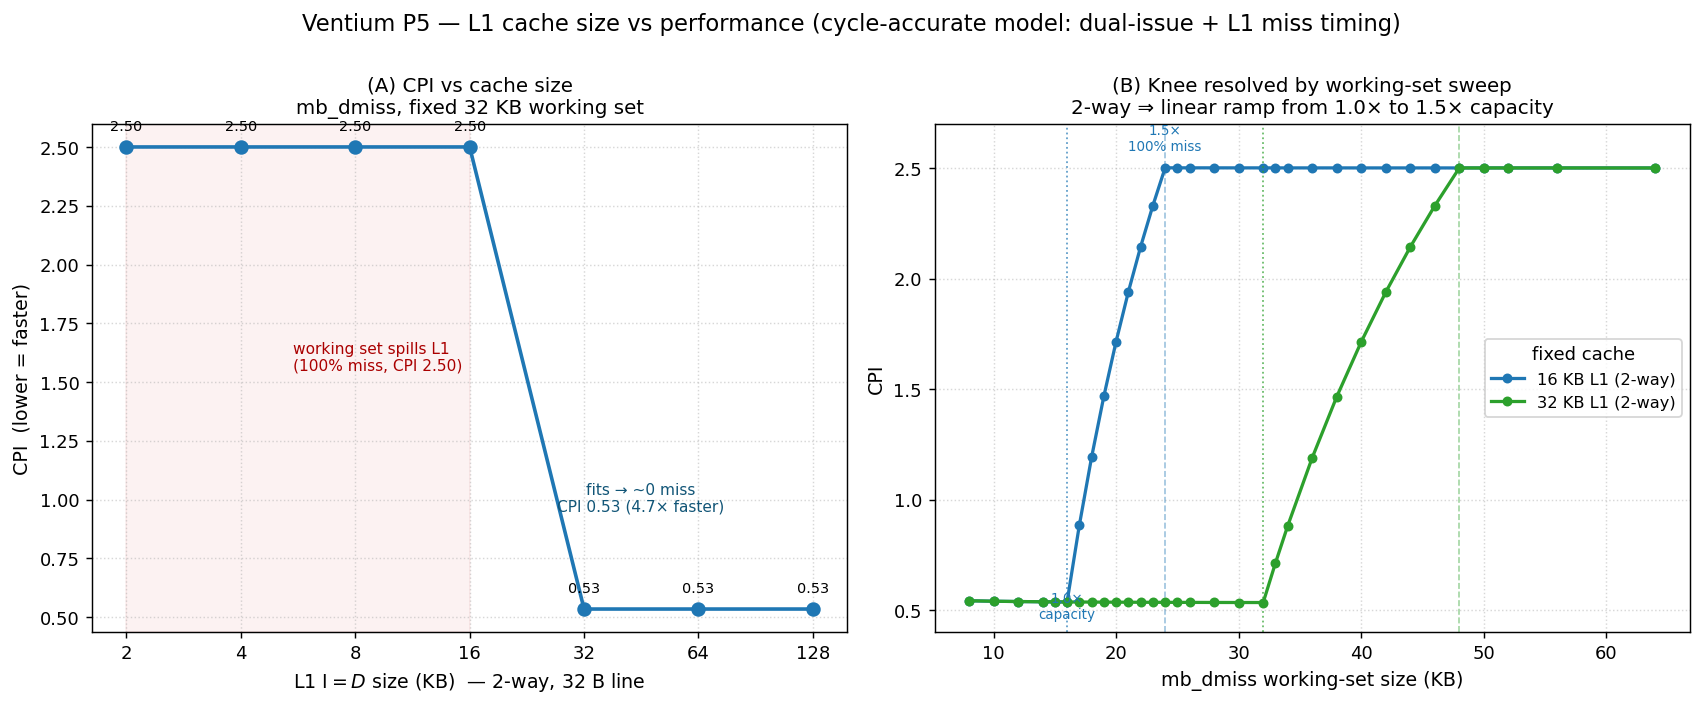
(A) CPI of the mb_dmiss cache-stress kernel as the L1 size is swept
2–128 KB (fixed 32 KB working set). (B) The same knee resolved at fine
resolution by instead sweeping the working set against fixed 16 KB and
32 KB caches — revealing that the transition is a linear ramp from 1.0× to
1.5× of capacity, and that it scales exactly with cache size.
What is measured, and on what
The L1 timing model (a read-allocate, two-way-LRU hit/miss state machine
with an 8-clock miss penalty, matching the p5trace.so oracle’s
l1_access()) is only active in cycle_mode — i.e. under the testbench’s
--cycle flag, which also enables dual-issue. In plain functional mode the
caches still serve data but their timing is not charged, so cache size has no
effect on the clock count. Every number here therefore comes from a --cycle
run, and the metric is CPI = core clocks ÷ retired instructions, read from
the testbench’s end-of-run retired N instructions in M clocks line.
The workload is ``mb_dmiss``, the directed D-cache-stress kernel from the M5 suite. It strides a load by exactly one 32-byte line through a buffer far larger than the cache, so — once the working set no longer fits — every load touches a freshly-evicted line and misses, adding the full 8-clock penalty. Because cache size changes only timing, never the retired-instruction stream, a fixed instruction budget makes the CPI of different geometries directly comparable.
Note
Why not Dhrystone? Two reasons. First, Dhrystone’s working set is a few
KB — it fits in even the smallest L1 here, so it would sit on the fast
plateau across the whole sweep and show no knee at all; mb_dmiss is
purpose-built to expose the cache-size dependence. Second, and more
fundamentally, Dhrystone cannot currently run in cycle_mode: the
dual-issue path mishandles the set_thread_area / %gs TLS setup and
diverges at the first ret after libc init. (It runs bit-exactly in
functional mode — that path is verified against QEMU — but functional mode
does not model cache timing.) cycle_mode is validated against the
p5trace.so oracle only on the flat, syscall-free mb_* micro-kernels,
which is exactly the class mb_dmiss belongs to.
Panel A — the cache-size knee
Sweeping the unified L1 size (I$ = D$) from 2 KB to 128 KB against mb_dmiss’s
32 KB working set:
L1 size |
sets (2-way) |
CPI |
rel. perf |
D-cache behaviour |
|---|---|---|---|---|
2 KB |
32 |
2.50 |
1.00× |
100 % miss |
4 KB |
64 |
2.50 |
1.00× |
100 % miss |
8 KB |
128 |
2.50 |
1.00× |
100 % miss (production geometry) |
16 KB |
256 |
2.50 |
1.00× |
100 % miss |
32 KB |
512 |
0.53 |
4.68× |
working set fits |
64 KB |
1024 |
0.53 |
4.68× |
fits |
128 KB |
2048 |
0.53 |
4.68× |
fits |
The knee lands exactly at 32 KB — where the 1024-line working set first fits the 512-set × 2-way cache. Below it, every load misses and the 8-clock penalty dominates (CPI 2.50). At and above it, misses vanish and the dual-issue pipeline pairs the loop body two instructions per clock, giving a sub-1.0 CPI of 0.53 — a 4.7× speedup. Past the knee, more cache buys nothing: the working set already fits.
The 8 KB point (the production geometry) reproduces the M5 golden CPI of 2.50, which is a useful cross-check that the parametrically-sized configurations match the shipping cache exactly.
Panel B — resolving the knee (and the 2-way fingerprint)
The cache size is quantized: with a 32-byte line the set count and the
associativity are each a power of two (the index is a clean bit-slice,
addr[5 +: $clog2(SETS)]), so a D-cache size is always sets × ways × 32 B
with both factors powers of two — there is no arbitrary 20 KB or 24 KB point.
Associativity itself is now a compile-time knob (VEN_L1_WAYS — see
Parametric L1 Caches), which adds geometry points (e.g. 128 sets at 2/4/8-way =
8/16/32 KB), but the knee is most cleanly resolved by its dual: since it is
governed by working set ÷ capacity, hold the cache fixed and sweep the
working set at arbitrary resolution (just recompiled mb_dmiss variants — no
RTL rebuild).
Doing so at a fixed 16 KB cache exposes the internal structure the coarse sweep hid:
Working set |
ratio |
CPI |
what is happening |
|---|---|---|---|
≤ 16 KB |
≤ 1.0× |
0.54 |
fits in two ways → ~0 misses |
17 KB |
1.06× |
0.88 |
first sets see a 3rd competing line → thrash begins |
18 KB |
1.13× |
1.19 |
|
20 KB |
1.25× |
1.72 |
|
22 KB |
1.38× |
2.14 |
|
24 KB |
1.5× |
2.50 |
every set sees ≥ 3 lines → 100 % miss (saturated) |
The transition is a clean linear ramp from 1.0× to 1.5× capacity, and that slope is the two-way-associativity fingerprint. A sequential line-stride starts thrashing the instant a set sees a third competing line (just past 1.0×), and thrashes completely once every set does — which for this access pattern happens at exactly 1.5× capacity, not 2×. A direct-mapped cache would knee almost instantly; a fully-associative cache would stay flat until exactly 1.0× and then cliff. The 1.0×→1.5× ramp is specifically what two-way gives.
The knee also scales exactly with cache size: the 32 KB curve is the 16 KB curve stretched 2× (flat to 32 KB, ramp 32→48 KB, flat after), and the two curves coincide at equal ratios — e.g. a 1.125× working set gives CPI 1.19 on both — confirming that performance in this regime depends only on working-set/capacity, not on absolute size.
Methodology and reproduction
Cache geometry is selected by the IC_SETS / DC_SETS localparams in
rtl/core/core.sv (default 128 sets = 8 KB; +VEN_CACHE_HALF = 64 sets =
4 KB), which parameterise the icache and dcache_timing modules
(logic [TAGW-1:0] tag [SETS][2] etc., so the arrays scale automatically).
For the sweep each size was built into its own obj_dir with an extra
+define overriding the set count, then mb_dmiss (and a many-sweep
variant, so the one mandatory cold sweep amortises to a clean steady state) was
run under --cycle. The host-compiler optimisation level does not affect the
cycle counts — only Verilator’s simulation speed — so it is irrelevant to the
result.
This is a performance characterisation, not a verification gate: all
geometries remain functionally bit-exact (a smaller cache only does more fills
of the same bytes). The shipping 8 KB / 2-way / 32 B geometry is the one
validated cycle-accurately against the p5trace.so oracle; see the M5 cache
bands and The r4 SRT divider and the FDIV bug for the broader cycle-model methodology, and
References for the timing-model sources.